
About this template
Make percentages tangible with visual representations in bars, circles, and a comprehensive overview.
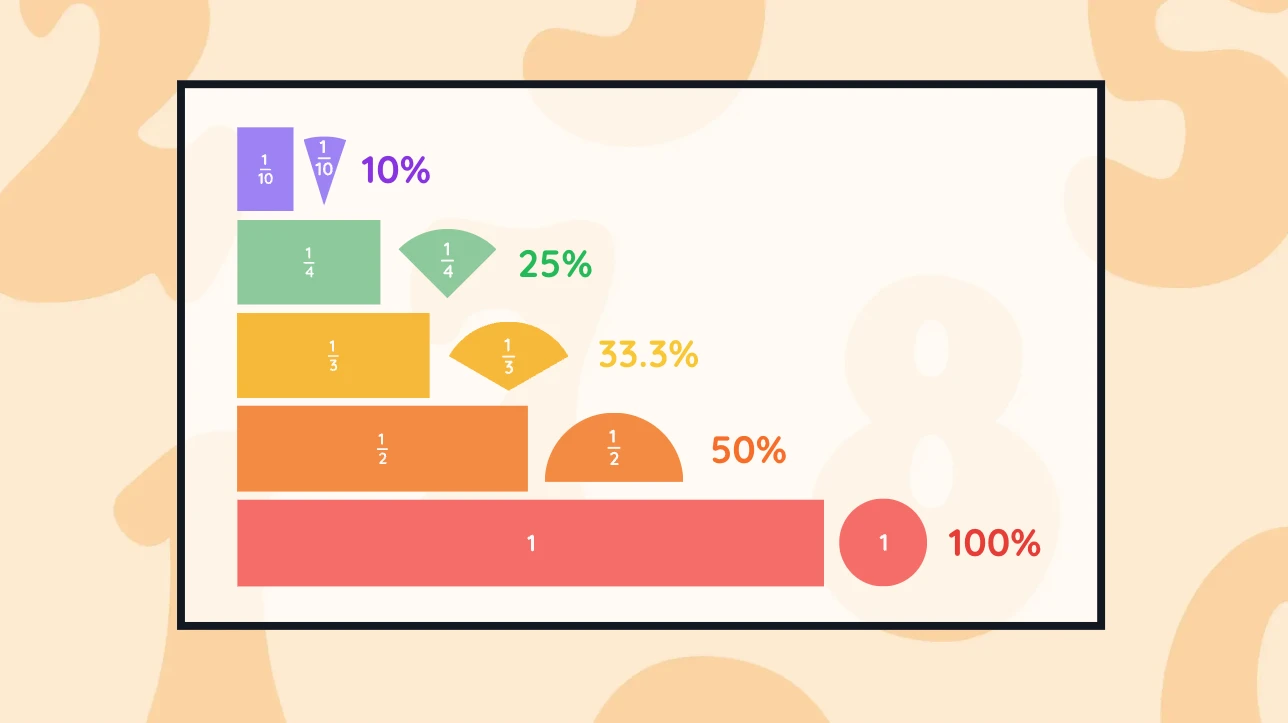
Image 1
Image 2
Image 3
How it works
This template includes three interactive screens:
- Overview: All elements are combined to show how bars, circles, and totals fit together to create a clear, visual understanding of percentages.
- Bars: Students explore percentages through bar graphs, adjusting proportions to match percentages.
- Circles: A circular chart helps students see percentages as parts of a whole, reinforcing the relationship between fractions and percentages.
This activity promotes a deeper comprehension of how percentages operate in various contexts and provides a hands-on approach to learning.
tip:
Challenge students to create their own visual representations or relate percentages to real-world scenarios, like sports stats or survey data, for added engagement!


